Visual Testing
How does visual testing work?
Visual Testing in Toolium is a tool for checking automatically if your web pages or mobile apps are rendered as expected. Tests are executed the same way, both on Selenium and Appium.
To achieve this goal, this tool follows these steps:
It takes a screenshot of the current web page or mobile screen (a full screenshot or a single element).
Then, if exists a previous capture with the same name, it compares both of them and shows their differences.
If not, it saves the screenshot to be used as a base in later executions. Probably these images might be reviewed manually to assure that can be used as expected result.
As web pages and mobile applications look different when using different browsers, mobile devices, resolutions, etc. Toolium provides you with a way of storing different base images, called baselines, through a configuration property called baseline_name.
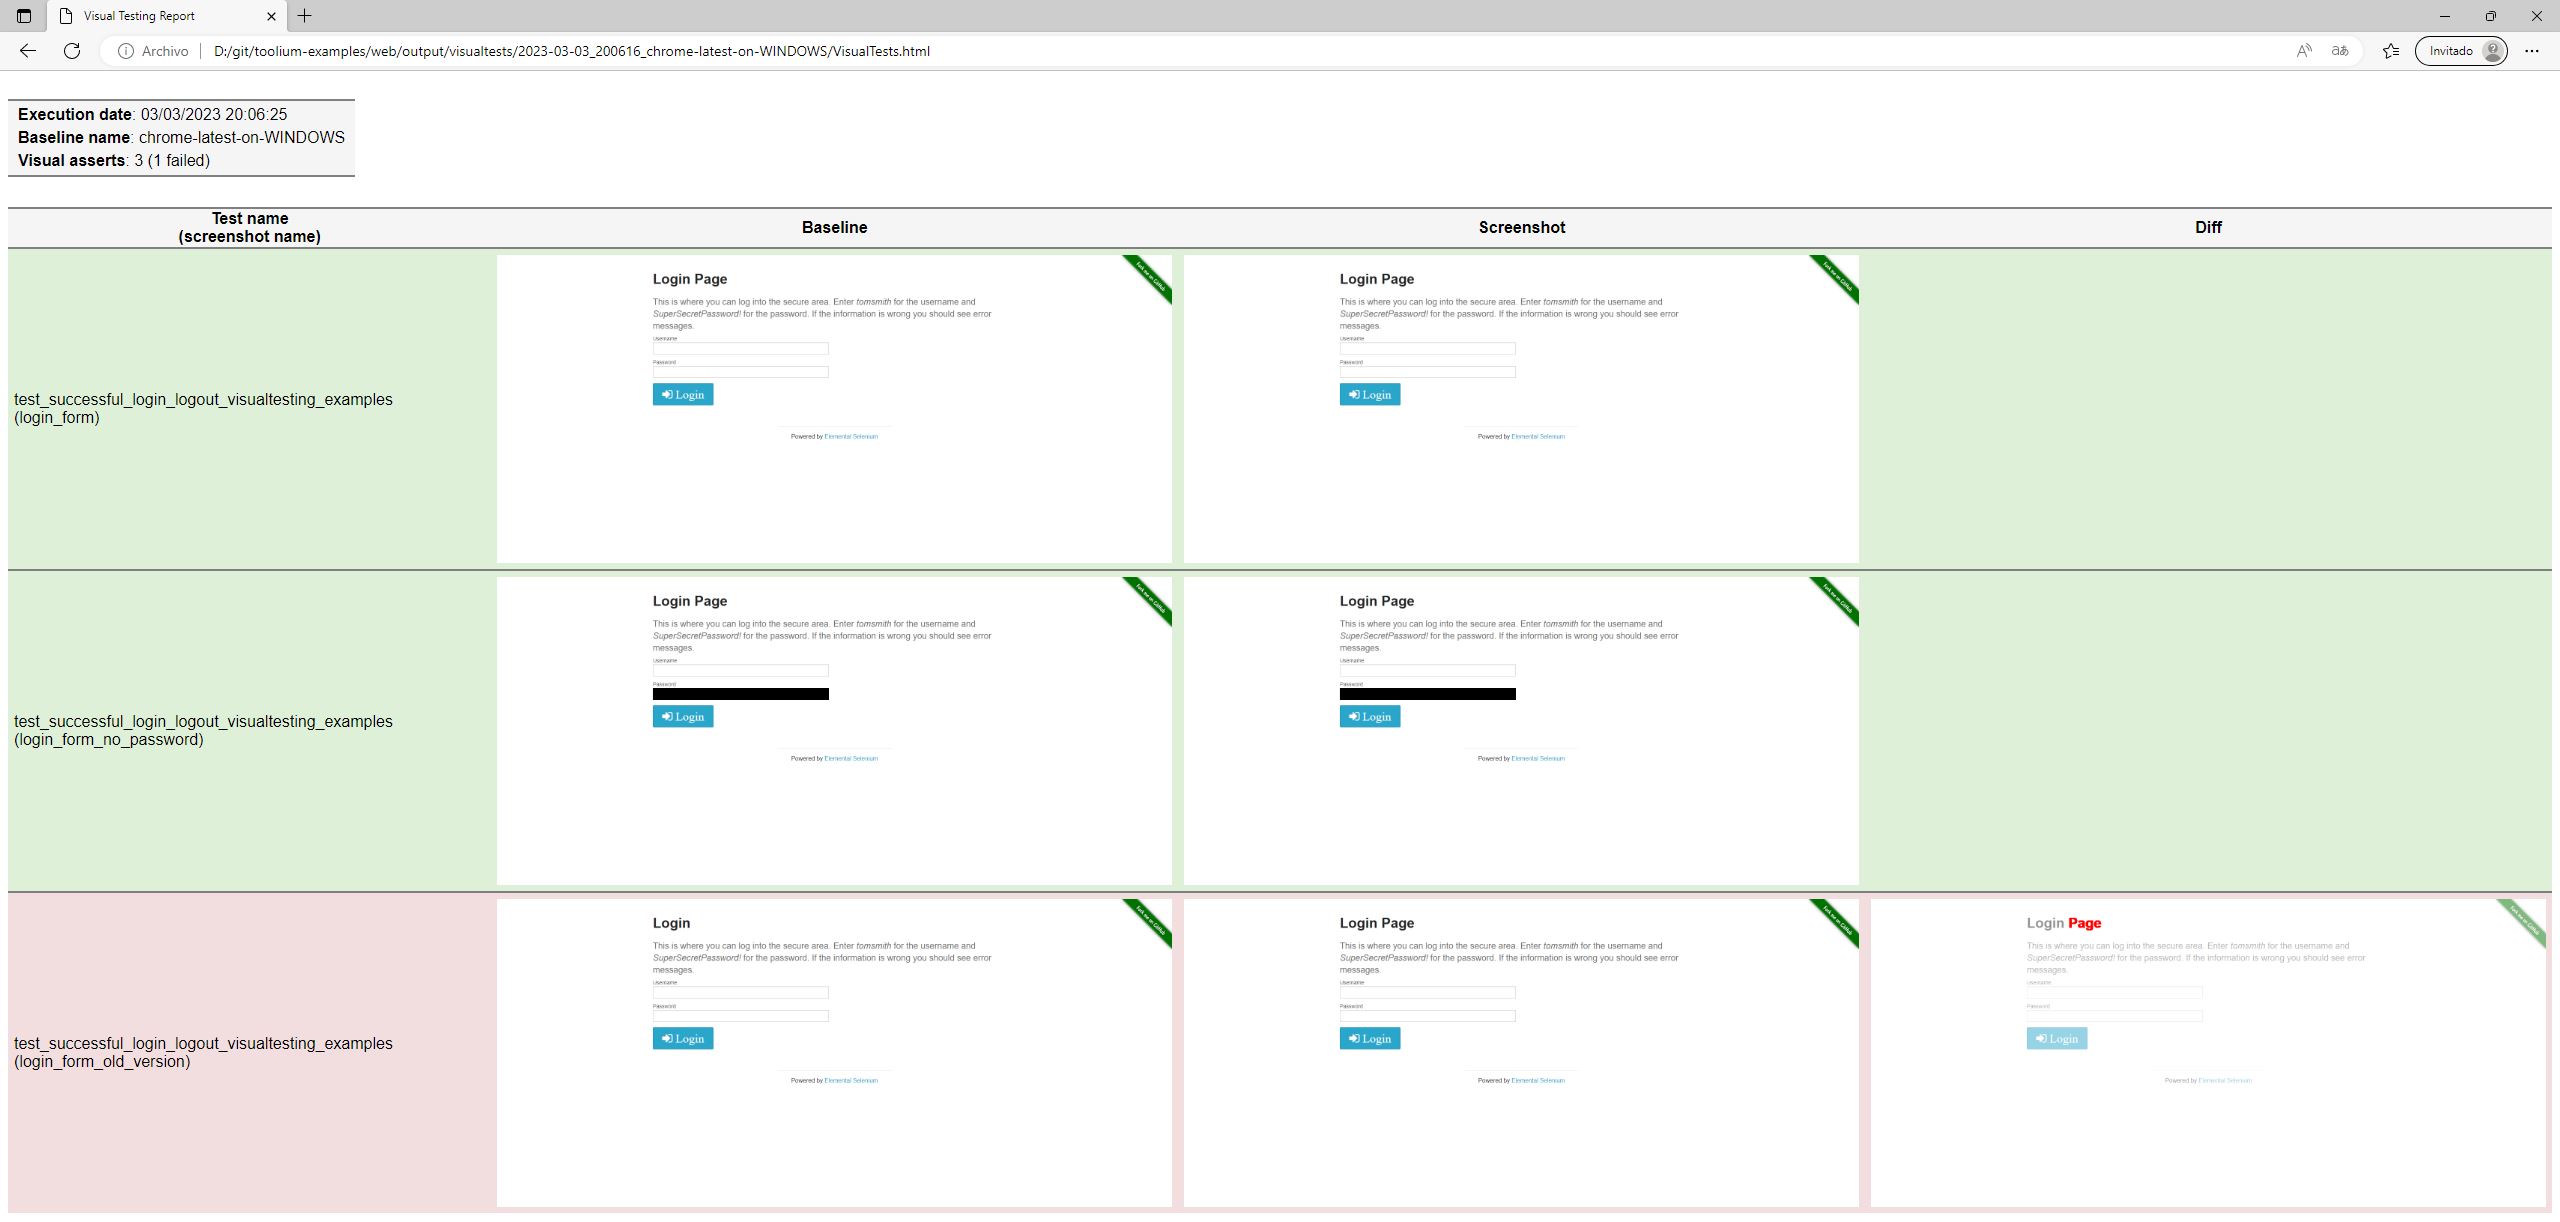
After every execution, the tool generates a HTML report with the screenshots and the resulting comparisons. The following figure shows an example of this report. As can be seen, there’s a row per assert in your tests, with its background in green or red, depending on the comparison.
How to execute it?
Visual asserts could be used in different ways:
Comparing a full page screenshot with the expected result: a previously captured image with the same screenshot_name
self.assert_full_screenshot(screenshot_name)
Comparing a single element, represented by a PageElement
form_page_element = PageElement(By.XPATH, '//form')
self.assert_screenshot(form_page_element, screenshot_name)
or
form_page_element = PageElement(By.XPATH, '//form')
form_page_element.assert_screenshot(screenshot_name)
Comparing a single element, represented by a WebElement
form_element = self.driver.find_element(BY.XPATH, '//form')
self.assert_screenshot(form_element, screenshot_name)
Comparing a single element, represented by its locator
form_element_locator = (By.XPATH, '//form')
self.assert_screenshot(form_element_locator, screenshot_name)
Moreover, elements can be excluded from full or element comparisons. The elements to be excluded can also be identified by a PageElement, a WebElement or a locator.
page_element_1 = PageElement(By.ID, 'first_id')
page_element_2 = PageElement(By.ID, 'second_id')
self.assert_full_screenshot(screenshot_name, exclude_elements=[page_element_1, page_element_2])
Both comparing methods have an optional parameter called threshold that marks the percentage of pixels that are allowed to be different. It must be a number between 0 and 1.
self.assert_full_screenshot(screenshot_name, threshold=0.1)
They have other optional parameter called force that forces to compare the screenshot even if visual testing is disabled by configuration. If the assertion fails, the test fails.
self.assert_full_screenshot(screenshot_name, force=True)
How to configure it?
Baseline folder
The baseline folder must contain the images that will be used as reference in visual testing asserts. Besides, when configuring save: true, the screenshots will be saved there.
The baseline folder by default is output/visualtests/baseline, but it can be changed through a system property, as can be seen in the following example:
$ export TOOLIUM_VISUAL_BASELINE_DIRECTORY=resources/baseline
When using behave, it can also be configured in before_all method:
from toolium.behave.environment import before_all as toolium_before_all
from toolium.config_files import ConfigFiles

def before_all(context):
    context.config_files = ConfigFiles()
    context.config_files.set_visual_baseline_directory('resources/baseline')
    toolium_before_all(context)
When using nose2, it can also be configured in setUp method:
from toolium import test_cases

class SeleniumTestCase(test_cases.SeleniumTestCase):
    def setUp(self):
        self.config_files.set_visual_baseline_directory('resources/baseline')
        super(SeleniumTestCase, self).setUp()
Visual Testing properties
Toolium properties related to Visual Testing are stored in properties.cfg as
[VisualTests]
enabled: true
fail: false
save: false
complete_report: true
baseline_name: {Driver_type}
enabled | true: visual testing is enabled, screenshots are captured and compared | false: visual testing is disabled, no screenshots are captured
fail | true: if a visual assertion fails, the test fails | false: although a visual assertion fails, the test passes
save | true: baseline images will be overwritten with new screenshots | false: screenshots will be compared with already saved baseline images
complete_report | true: html report will contain failed and passed visual assertions | false: html report will only contain failed visual assertions
baseline_name | It contains the name of the images base to compare current execution screenshots with, and it might depends on the browser, the mobile device or resolution used in the execution. | The easiest way of generating a custom name per environment is to use the values of other configuration properties. To access a property value use the following format: {SectionName_optionName}. | Some examples of baseline_name values are:
{Driver_type}: depending on the value of type property, baseline_name might take one of these values: firefox, iexplore, chrome… This is the value by default.
{Driver_type}-{Capabilities_browserVersion}-{Capabilities_platformName}: baseline_name might take one of these values: iexplore-11-windows, safari-9.0-mac…
{AppiumCapabilities_deviceName}-{AppiumCapabilities_platformVersion}: baseline_name might take one of these values: iPhone_6-8.3, iPhone_6-9.1, iPhone_6s-9.1…
{PlatformVersion}: baseline_name will take the value of the mobile platform version, instead of the platformVersion configuration property
{Version}: baseline_name will take the value of version capability, although it is not configured
{RemoteNode}: baseline_name will take the value of the remote node name
How to view Visual Testing report in Jenkins?
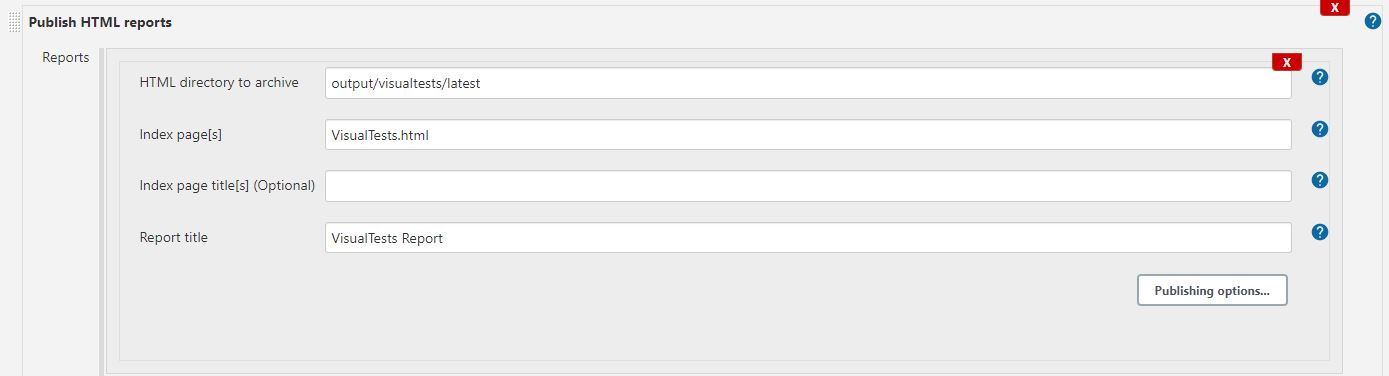
The HTML report is generated in output/visualtests/latest folder together with screenshots and baseline images. One option to visualize this report in Jenkins is using HTML Publisher plugin. Install it in your Jenkins instance, access to your Jenkins job configuration and add a new Publish HTML Reports Post-Built Action. Configure output/visualtests/latest as HTML directory to archive and VisualTests.html as Index page, as shown in the following image:
Take into account that the report could be not properly visualized in Chrome due to cookies management: https://stackoverflow.com/questions/69928196/chrome-not-sending-session-cookie-for-css-files-published-on-jenkins